Hi,
This is to wish you all a Very Very Happy, Healthy and Prosperous New Year.
Hope that DreamTai trading software will help you in making profitable investments in stocks.
Monk: what are the new changes in the next release that we can see ? when is the release date ?
The new version will be released in Jan first week.
It will have Report generation capabilities and ability to take screen shots and save it.
Will let you know about the release.
Sanjoy
Sunday, December 31, 2006
Thursday, December 28, 2006
DreamTai Stock Trading Software:Thursday, Dec 28, 2006
(c) Dreamtai Stock Trading Software
Disclaimer: For education/entertainment purpose only. Invest at your own Risk
On Wednesday, the Dow closed at 12,510 which is 102 points higher than the previous close of 12,407

As long as the index is in the upwards sloping channel, the trend is bullish.
Some picks
I have put here the scans of all the Nasdaq 100 stocks using TradeStation.
The scans are for those stocks which have trended up or down in the past month.
UPTRENDING:

DOWNTRENDING :

Question from Tom:
If your buying stocks at there 52 week low is it better to buy when chart turn green?
I'm looking for support thanks. I just want to buy when price is low.
Hi,
The problem is that no one can predict when an exact low has been reached.
The stock can go lower also..It can go uptil zero.
So, it is very risky trying to buy lows.
DreamTai is better suited for buying at Highs, when the trend is in our favour and is helping up to push the stock up.
Have a look at Enron in the following page
http://dreamtai.blogspot.com/2006/05/money-management-market-survival.html#links
If you had purchased it at low, you would have made a huge loss.
It is like catching falling knives.
Here is another link
http://dreamtai.blogspot.com/2006/04/gentleman-from-ireland-saturday-april.html#links
Question from David:
Current dreamtai does not show afterhour prices ? or am i not doing some thing right ?
same with pre market prices do not show up
DreamTai automatically downloads prices from Yahoo Finance.
Yahoo does not have pre and post market data.
If you want real time data, try using TradeStation software.
Question from David:
You had said you have stared a subscription to RadarScan from TradeStation, how do i get it ?
RadarScan is a very useful scanning tool where you can create your own customised scan.
You have to subscribe to TradeStation charting platform.
Go to http://www.tradestation.com for more details.
Question from David:
Does Dreamtai has inbuilt scans ? Do yo plan on implementing scans in dreamtai ?
No, at present it does not have scans. We may put it in future.
(c) Dreamtai Stock Trading Software
Tuesday, December 26, 2006
DreamTai Stock Trading Software:Wednesday, Dec 27, 2006
(c) Dreamtai Stock Trading Software
Disclaimer: For education/entertainment purpose only. Invest at your own Risk
On Tuesday, the Dow closed at 12,407 which is 64 points higher than the previous close of 12,343

As long as the index is in the upwards sloping channel, the trend is bullish.
Some picks
I have put here the scans of all the Nasdaq 100 stocks using TradeStation.
The scans are for those stocks which have trended up or down in the past month.
UP

DOWN

Question from Mike:
Mike said...
How come I'm seeing different power rankings on my end, for example, EXPE is listed as a 4.8 on my power ranking in DT...
My apologies. I have mis-labeled the column as Power Ranking in the figure. I have changed the label name.
That figure is the percentage increase in price over the past five weeks
So, you have all the Nasdaq 100 stocks sorted in order of greatest increase in price over the past month.
Comparing yesterday's figure with today's figure, we can see that JOYG and CMCSA have increased a lot.
This scan can be used as a filter to identify fast moving stocks.
Again, I am just testing. I would love to hear your feedback on how this scan is helping you.
(c) Dreamtai Stock Trading Software
Monday, December 25, 2006
Questions from George & Tom
Questions from George & Tom
George: How can you use deamtai to help short a stock ?
24 Dec 06, 14:00
George: When do you typically short a stock and what rules one should follow?
23 Dec 06, 01:56
Tom: If you buy stocks at there 52 week low do you like to buy when charts read red?
Hi,
We buy stocks which are in an uptrend and short stocks which are in a downtrend.
Here are the articles explaining in detail.
New Buy New Sell
http://dreamtai.blogspot.com/2006/04/confusion-too-many-transactions-friday.html#links
Buying and Selling through DreamTai
http://dreamtai.blogspot.com/2006/04/buying-and-selling-through-dreamtai.html#links
http://dreamtai.blogspot.com/2006/05/stock-trend-and-trading-strategy.html#links
Shorting
http://dreamtai.blogspot.com/2006/05/dreamtai-stock-trading-software-what.html#links
-Sanjoy
DreamTai Stock Trading Software:Tuesday, Dec 26, 2006
(c) Dreamtai Stock Trading Software
Disclaimer: For education/entertainment purpose only. Invest at your own Risk

On Friday, the Dow closed at 12,343 which is 78 points lower than the previous close of 12,421
As long as the index is in the upwards sloping channel, the trend is bullish.
I have started subscription to RadarScan from TradeStation.
It is a scanning engine which can scan ALL stocks of Nasdaq or S&P or your own custom list. You can create your own scanning criteria.
I have put here the scans of all the Nasdaq 100 stocks using TradeStation.
The scans are for those stocks which have trended up or down in the past month.
Let us check how this scan performs. Please feel free to leave feedback.
UPTRENDING STOCKS:

DOWNTRENDING STOCKS

The stocks are sorted as per their movement in the last month.
The Ranking indicated how much the stocks have trended.
If higher positive ranking, then they have moved up a lot.
If lower negative ranking, it means they have moved down a lot.
(c) Dreamtai Stock Trading Software
Thursday, December 21, 2006
Searching for High Power Ranking stocks
Comment from Anonymous:
Still Tying to find higher power rankings 5 plus. How is the power rating calculated? By Volume and what else. I have some EFT's DIA QQQQ SPY etc. and thy all have low PR and their average volume is higher to some of the small caps I also have in my watch list.
Dear Sir/Madam,
Try looking for stocks which are at their 52 week high. They will have higher power ranking.
Look at your daily newspaper for those stocks which closed at their yearly high.
Here is a link to a scanner
http://stockcharts.com/def/servlet/SC.scan
Another way is to see the Monday edition of investor Business Daily ( if you are in USA) to check the top 100 stock list.
Sincerely,
Sanjoy
Sunday, December 17, 2006
Can't have them all!!
Look at the previous posts.
Stocks like GROW, MAMA, AKAM have trend and pushed up.
But we were not successful in stocks like ATI which went down from 98 to 88.
We had another stock in pick with ticker symbol TAR
It went as high as 26 and then crashed down to 18 at present.
That is why we risk only two percent of our equity on each trade.
So, we do not run the risk of ruin if any one stock pick does not work out.
At the same time, if any our our picks are successful, we can add more to our positions and make huge profits.
It is a game of chance in which we are trying to RIG the market in our favour by betting only on those stocks which show promise based on trend, volume and momentum.
At the same time, we are betting just two percent on each stock.
You can not do THAT in the casino..can you ?
In the words of Kenny Rogers "You have to know when to hold them, know when to fold them."
Trading is a percentage game.
Burn that rule into your brain and you'll save yourself a lot of headaches.
DreamTai Stock Trading Software:Monday, Dec 18, 2006
(c) Dreamtai Stock Trading Software
Disclaimer: For education/entertainment purpose only. Invest at your own Risk
BULLISH TREND !!!
On Friday, the Dow closed at 12,445 which is 28 points higher than the previous close of 12,416

Currently, the market has started trending upwards in an upward sloping channel.
Note that the last price bar has turned Green, which implies bullishness.
As long as the index is in the upwards sloping channel, the trend is bullish.
Some picks
BMET

MICC

TEVA (for shorting)

Here are some international stocks if you are interested
BT

VOD

PKX

CAJ

(c) Dreamtai Stock Trading Software
Monday, December 11, 2006
DreamTai Stock Trading Software:Tuesday, Dec 12, 2006
(c) Dreamtai Stock Trading Software
Disclaimer: For education/entertainment purpose only. Invest at your own Risk
On Monday, the Dow closed at 12,328 which is 21 points higher than the previous close of 12,307
Currently, the market is trendless...neither bullish nor bearish..

The next support level is around 12000 as shown in the chart.
If the index goes below the support level, the trend is supposed to have fully changed to bearish.
Some picks for the adventerous.
AKAM:

EWM:

GROW:

(c) Dreamtai Stock Trading Software
Sunday, December 10, 2006
DreamTai Stock Trading Software:Monday, Dec 11, 2006
(c) Dreamtai Stock Trading Software
Disclaimer: For education/entertainment purpose only. Invest at your own Risk
On Friday, the Dow closed at 12,307 which is 29 points higher than the previous close of 12,278
Note that the trend has changed as the index has gone below the upwards trending channel.
Please try to take profits and offload part of your long positions.
Currently, the market is trendless...neither bullish nor bearish..
DJI Index:

The next support level is slightly below 12000 as shown in the chart.
If the index goes below the support level, the trend is supposed to have fully changed to bearish.
Some picks for the adventerous.
Just monitor your current positions and take partial profits.
EWM:

EWO:

GROW:

MAMA:

RKT:

AKAM:

ATI:

BTJ:

CRVL:

Wednesday, December 06, 2006
DreamTai Stock Trading Software:Wednesday, Dec 6, 2006
(c) Dreamtai Stock Trading Software
Disclaimer: For education/entertainment purpose only. Invest at your own Risk
Today, I can not upload images to the blog due to some technical issue, so I am just giving the stock names.
On Tuesday, the Dow closed at 12,331 which is 47 points higher than the previous close of 12,283
Note that the trend has changed as the index has gone below the upwards trending channel.
Currently, the market is trendless...neither bullish nor bearish..
The next support level is slightly below 12000 as shown in the chart.
If the index goes below the support level, the trend is supposed to have fully changed to bearish.
Here are some picks:
STEC
http://finance.yahoo.com/q/bc?s=STEC&t=1y&l=on&z=l&q=c&c=
MWP
http://finance.yahoo.com/q/bc?s=MWP&t=1y&l=on&z=l&q=c&c=
BITI
http://finance.yahoo.com/q/bc?s=BITI&t=1y&l=on&z=l&q=c&c=
(c) Dreamtai Stock Trading Software
Sunday, December 03, 2006
DreamTai Stock Trading Software:Monday, Dec 3, 2006
DreamTai Stock Trading Software:Monday, Dec 3, 2006
(c) Dreamtai Stock Trading Software
Disclaimer: For education/entertainment purpose only. Invest at your own Risk
Dow Jones Index:

On Friday, the Dow closed at 12,194 which is 27 points lower than the previous close of 12,221
Note that the trend has changed as the index has gone below the upwards trending channel.
Please try to take profits and offload part of your long positions.
Currently, the market is trendless...neither bullish nor bearish..
The next support level is slightly below 12000 as shown in the chart.
If the index goes below the support level, the trend is supposed to have fully changed to bearish.

Statue outside Delhi
Photo by soylentgreen23
No new picks today.
Just monitor your current positions and take partial profits.
If you look at the weekly charts, it does not look so bad at all..Just a healthy reaction to a long term upward trend.
Dow Jones Index (Daily) :

Dow Jones Index (Weekly) :

(c) Dreamtai Stock Trading Software
(c) Dreamtai Stock Trading Software
Disclaimer: For education/entertainment purpose only. Invest at your own Risk
Dow Jones Index:

On Friday, the Dow closed at 12,194 which is 27 points lower than the previous close of 12,221
Note that the trend has changed as the index has gone below the upwards trending channel.
Please try to take profits and offload part of your long positions.
Currently, the market is trendless...neither bullish nor bearish..
The next support level is slightly below 12000 as shown in the chart.
If the index goes below the support level, the trend is supposed to have fully changed to bearish.
Statue outside Delhi
Photo by soylentgreen23
No new picks today.
Just monitor your current positions and take partial profits.
If you look at the weekly charts, it does not look so bad at all..Just a healthy reaction to a long term upward trend.
Dow Jones Index (Daily) :

Dow Jones Index (Weekly) :

(c) Dreamtai Stock Trading Software
Saturday, December 02, 2006
Stocks Support Resistance Theory
As you have been seeing lately, the Dow Jones index has been coming out of the upwards trending channel support.
That means that the Dow is no longer in an upward trend.
Here is a good article on the theory of support and resistance.
http://www.investopedia.com/articles/trading/06/supportresistancereversal.asp
That means that the Dow is no longer in an upward trend.
Here is a good article on the theory of support and resistance.
http://www.investopedia.com/articles/trading/06/supportresistancereversal.asp
Wednesday, November 29, 2006
DreamTai Stock Trading Software:Wednesday, Nov 29, 2006
(c) Dreamtai Stock Trading Software
Disclaimer: For education/entertainment purpose only. Invest at your own Risk
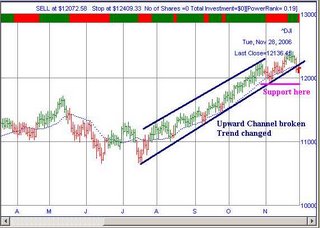
On Tuesday, the Dow closed at 12136 which is 14 points higher than the previous close of 12121
Note that the trend has changed as the index has gone below the upwards trrending channel.
Please try to take profits and offload part of your long positions.
The next support level is slightly below 12000.
If the index goes below the support level, the trend is supposed to have fully changed.
It is safer not to enter any new long positions at this time.
(c) Dreamtai Stock Trading Software
Stock Volume Scanners on a weekly or monthly basis
Question from a member:
I'm trying to get higher power ranking stocks to look at, has anyone created a screener in MSN or Yahoo that will show those accounts with a sizable increase in volume compared to a week ago, month ago etc?
Answer:
At present, I have not heard of such a screener. If any of our members have seen such a screener, can you please comment here ?
I have seen screeners on daily basis increase in volume.
Here are some links:
http://stockcharts.com/def/servlet/SC.scan
Look at Strong Volume Gainers Section
It also has Stocks in a New Uptrend (Aroon) and Stocks in a new uptrend (ADX) screeners.
http://investors.com
Look at the Stocks on the Move Section
http://bigcharts.marketwatch.com/reports
Look at the Stocks with the largest % gain in volume section
Please share with others if you know of any other stock screeners.
Saturday, November 25, 2006
Using Stops
Today I will discuss about Stops, how to place them and the types of Stops.
It does not matter at what price you buy a stock. What matters is what price you sell the stock.
The price at which you can enter a stock position is not under your control. At one time Google was 200 and now it is $500. Even if I want, I can not buy it at 200. The entry price is not under my control.
However, once you buy it, you can sell at any time you want. The price at which you will sell will determine whether you have made a profit or a loss. You can sell it now, you can sell after 2 weeks.or whenever you want.
That is why, the placement of stops is very important.
There are two ways of placing stops:
1. Volatility Stops
2. Stops at nearest Support or Resistance.
DreamTai uses Volatility Stops.
It calculates the average range a stock moves per day and stops are placed at 3 or 4 times the average range in order to give it some space to move.
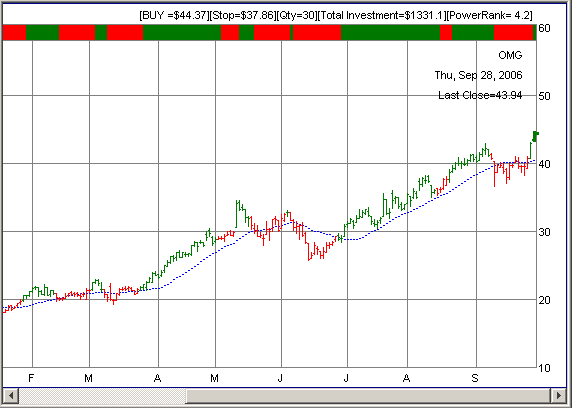
Here, let me explain with the help of an example. Look at the stock OMG. We had recommended buying it on September 29, 2006 at 44.37 and asked to place a stop at 37.86 which was the Volatility Stop.
http://dreamtai.blogspot.com/2006/09/dreamtai-stock-trading-software-friday_29.html#links

If instead of Volatility Stop, you wanted to place a Support Resistance Stop, you will place the stop at the nearest support point, which in this case come to be around 36-37. It is safer to place the stop at slightly below the support point, say at 35 to prevent being stopped out by price spikes.
In this case, the Volatility Stop and the Support-Resistance Stop are nearly the same.
Look the the current chart of OMG. OMG had gone upto 60 and then a SELL signal was issued.
Currently OMG should be shorted. Dreamtai is giving a SELL SHORT at 45.09 and is asking to place a BUY stop at 51.02
Now, here is a QUIZ QUESTION for you. If you want to place a Support Resistance Stop, where would you place the BUY Stop ?
It does not matter at what price you buy a stock. What matters is what price you sell the stock.
The price at which you can enter a stock position is not under your control. At one time Google was 200 and now it is $500. Even if I want, I can not buy it at 200. The entry price is not under my control.
However, once you buy it, you can sell at any time you want. The price at which you will sell will determine whether you have made a profit or a loss. You can sell it now, you can sell after 2 weeks.or whenever you want.
That is why, the placement of stops is very important.
There are two ways of placing stops:
1. Volatility Stops
2. Stops at nearest Support or Resistance.
DreamTai uses Volatility Stops.
It calculates the average range a stock moves per day and stops are placed at 3 or 4 times the average range in order to give it some space to move.
Here, let me explain with the help of an example. Look at the stock OMG. We had recommended buying it on September 29, 2006 at 44.37 and asked to place a stop at 37.86 which was the Volatility Stop.
http://dreamtai.blogspot.com/2006/09/dreamtai-stock-trading-software-friday_29.html#links
If instead of Volatility Stop, you wanted to place a Support Resistance Stop, you will place the stop at the nearest support point, which in this case come to be around 36-37. It is safer to place the stop at slightly below the support point, say at 35 to prevent being stopped out by price spikes.
In this case, the Volatility Stop and the Support-Resistance Stop are nearly the same.
Look the the current chart of OMG. OMG had gone upto 60 and then a SELL signal was issued.
Currently OMG should be shorted. Dreamtai is giving a SELL SHORT at 45.09 and is asking to place a BUY stop at 51.02
Now, here is a QUIZ QUESTION for you. If you want to place a Support Resistance Stop, where would you place the BUY Stop ?

The answer is around 55. The nearest resistance on top is at 52 to 53. So, place a stop slightly higher at 55.
The Volatility stop is better in cases where the stock is strongly trending and has a sudden zooming upwards movement. In that case, the Support Resistance point is very far off. So, it will be better to use the Volatility Stops.
See Google. It has zoomed up to 505. Now, if we use the Support Resistance stop, it comes to be around 470 but if we use Volatility Stop, it comes to be around 492. We can buy more quantity of Google if we use the Volatility Stop.

So, which stop to use ?
It does not matter which stop you use as long as the Risk per trade is less than 2 percent of your equity.
So, the next question is once you enter a position, should you use a trailing stop if the stock moves in your favour ?
Yes, it is always safe to use a trailing stop, but place it at the nearest support or resistance, otherwise, you will be stopped out by a price spike.
Member Questions on Power Ranking and Investing
MEMBER QUESTION: If the risk control is already built into DreamTai, then a portfolio approach really isn't necessary as a tool to minimize risk,
DreamTai has already factored that in right?
It depends on the investment approach you take. DreamTai does its job of risk control and market timing.
Now, it depends on you on how to build up your portfolio.
You can take the sector approach, like some portfolio managers do. Every week, look at Investor Business Daily and see which sectors are the hottest sector. Then find the hottest stock (stocks with larger power ranking in these hot sectors) and invest in these stocks.
Link for the HOTTEST Sectors:
http://bigcharts.marketwatch.com/industry/bigcharts-com/
Another approach is to look at the hottest trending stocks irrespective of their sector. If you notice that Google is speeding up and has a high power ranking, just buy it using DreamTai criterion.
Link for the hot stocks:
http://bigcharts.marketwatch.com/reports/
MEMBER QUESTION: Stock or EFTs (DIA, SPY,QQQQ)
What is the purpose of Power Ranking Tab in the DreamTai software ?
The stock power ranking shows the strength of the stock move. The higher the number, the more bullish the stock.
Suppose, there were two stocks that went up by two dollars.
For the first stock, the volume was one million, but for the second stock, the volume was thirty million. Obviously, there was a greater power for the second stock.
The Stock Power ranking measures the power. If you are considering to buy many stocks, you can input them in DreamTai and buy the stocks with the highest power ranking.
Conversely, if you are shorting, you should select the most negative power ranking stock.
Please refer the following page:
http://www.dreamtai.com/mainpages/questions.htm
Thursday, November 23, 2006
DreamTai Buy Signals and Risk Control
Question from a member:
Nice software!
Two questions, do you ever buy high power ranked stocks showing positive trend signals that are not listed as a buy on DreamTai?
Dear Sir/Madam,
Thanks for your kind words.
If there is a high power ranked stock showing positive trend signals but showing as red, I would wait till it turns green.
Here is the reason. First of all, no one can predict where the stock price will go..Not even the $20 million per year salary Wall Street Analysts.
Our aim is to maximise the probability of winning and minimise the risk of losing.
Here is how we do it.
1. The stock is above the blue moving average means it is in an uptrend.
2. The stock has high power ranking means there is a lot of buying volume.
3. The stock price bars are green means the stock upward momentum is turning positive.
4. We set the stop loss so if the stock goes down below a certain point, we are out.
This will give you better odds of winning and low risk of losing. The maximum risk to us is only 2 percent while the upward gains can be a lot.
So, it is safer to wait for a buy signal and then buy.
Question:
Also, every buy recommendation assumes I have $10,000, if I have $5,000 I divide the recommendation by two and fill up my portfolio with enough stocks to spread the risk?
Yes, you can do that. Our aim is to risk maximum 2 percent in any trade. If you want, you can risk one percent or 0.5 percent of your equity. As long as it is less than 2 percent, you are OK.
By the way, did I tell you about Edison's nephew and his investment style ? Oh..I love telling about him !!
Here is the link:
http://dreamtai.blogspot.com/2006/09/how-edisons-nephew-and-his-fellow.html
Wednesday, November 22, 2006
Easiest way to add remove stocks in DreamTai
Question by a member:
What is the easiest way to remove stock symbols, do I need to do it individually?
You can remove a stock individually by clicking on the Delete Stock button.
If you want to remove or add stocks in DreamTai in bulk, do the following:
Go to DreamTai folder and open the file stocklist.txt in notepad.
It contains all the stocks, one stock ticker per line.
You can edit that file and save it.
Tuesday, November 21, 2006
DreamTai Stock Trading Software:Wednesday, Nov 22, 2006
(c) Dreamtai Stock Trading Software
Disclaimer: For education/entertainment purpose only. Invest at your own Risk

On Tuesday, the Dow closed at 12321 which is 5 points higher than the previous close of 12316
Trend is still bullish as long as it is contained in the upwards trending Bullish Channel.
To all US members of this blog : Wish you a very very happy Thanksgiving Holidays!!
Photo: by Hey Paul
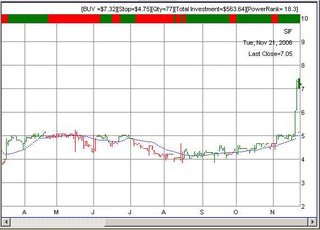
Here are some stock picks.
Also, have a look at MWRK and NYX
SQNM:

GROW:
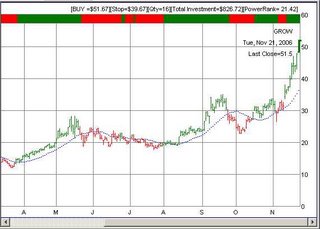
AMAG:

SIF:
(c) Dreamtai Stock Trading Software
Disclaimer: For education/entertainment purpose only. Invest at your own Risk
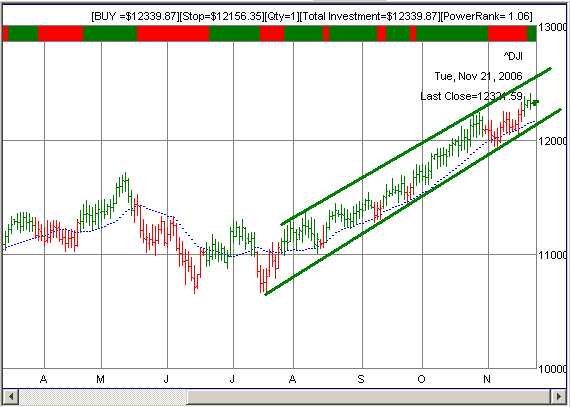
On Tuesday, the Dow closed at 12321 which is 5 points higher than the previous close of 12316
Trend is still bullish as long as it is contained in the upwards trending Bullish Channel.
To all US members of this blog : Wish you a very very happy Thanksgiving Holidays!!
Photo: by Hey Paul
Here are some stock picks.
Also, have a look at MWRK and NYX
SQNM:

GROW:

AMAG:

SIF:

(c) Dreamtai Stock Trading Software
Subscribe to:
Posts (Atom)