Wednesday, May 31, 2006

DreamTai Stock Trading Software: Thursday, June 1, 2006


(c) Dreamtai Stock Trading Software

Disclaimer: For education/entertainment purpose only. Invest at your own Risk


Today, the Dow Jones Index opened the session strongly but mid day lost steam and went down. It tried to go up by end of day but could not reach previous high. It managed to close by with a 74 point gain.


Again, it appears that the market is still choppy and is trying to get upto the channel, but is tooo weak and gets pushed down again and again.


As seen in the figure, two times the market tried to go above 11,200 and one time above 11,300, but it is getting pushed down at these levels.


If the market goes below 11,000, concentrate on short selling stocks.

Also, did you notice another thing ? The BLUE DOTTED MOVING AVERAGE LINE is getting to slope downwards, which does not look like a bullish sign.

Let us wait and see what happens.


(c) Dreamtai Stock Trading Software

Tuesday, May 30, 2006

DreamTai Stock Trading Software :Wednesday, May 31, 2006


(c) Dreamtai Stock Trading Software

Disclaimer: For education/entertainment purpose only. Invest at your own Risk


The Dow got a huge sell-off right from the beginning of the day.
The index sold off steadily the entire session and eventually closed the day with a big 184 point loss.

It appears that Dow is failing to rise up into the channel as shown.
Currently, Dow is in a flat mode trying to rise into the channel, but each time it rises, it is pushed back.

Below 11,000 it will be bearish.

let us see what develops.
I have listed some stocks for short selling.


(c) Dreamtai Stock Trading Software

Monday, May 29, 2006

New Other Resources Section

Today, I have added new materials in Other Resourses for those interested in looking at other investing avenues and resources.

DreamTai Stock Trading Software : Tuesday, May 30, 2006


(c) Dreamtai Stock Trading Software


Disclaimer: For education/entertainment purpose only. Invest at your own Risk


In our previous post, we had stated that on Thursday May 25, the Dow reached 11,211. It crossed the 11,200 mark and is now at the lower border of the channel.
It remains to be seen if it can maintain this upward move. It looks promising till now.


Well, the Dow opened the session higher and closed the day witha 68 point gain.

The index is trying to move into the upward channel. If the index moves below 11,000 then it is bearish.

Here are some Uptrending and some short sell candidates.

I am waiting for the Dow Jones Index to turn GREEN and go back into the channel completely.


(c) Dreamtai Stock Trading Software

Friday, May 26, 2006

DreamTai Stock Trading Software :Friday, May 26, 2006


(c) Dreamtai Stock Trading Software


Disclaimer: For education/entertainment purpose only. Invest at your own Risk


On Thursday May 25, the Dow reached 11,211. It crossed the 11,200 mark and is now at the lower border of the channel.

It remains to be seen if it can maintain this upward move. It looks promising till now.

No new stock picks for today. I prefer to wait and see.


(c) Dreamtai Stock Trading Software

Thursday, May 25, 2006

DreamTai Stock Trading Software : Thursday, May 25, 2006


(c) Dreamtai Stock Trading Software


Disclaimer: For education/entertainment purpose only. Invest at your own Risk


In last post I had said that if Dow goes above 11,200 then it is a bullish sign. Below 11,024 means that Dow wants to be bearish and is trending downwards.


Today, the Dow could not even go up to 11,200. It just consolidated and traded sideways. It appears that even now the market can not make up its mind decisively whether to go up or down.

So, it is still a wait and see to see where the markets will go.

I have some picks for SHORT SELLING


(c) Dreamtai Stock Trading Software

Wednesday, May 24, 2006

DreamTai Stock Trading Software : Wednesday, May 24, 2006


(c) Dreamtai Stock Trading Software


Disclaimer: For education/entertainment purpose only. Invest at your own Risk


In last post I had said that if Dow goes above 11,200 then it is a bullish sign. Below 11,070 means that Dow wants to be bearish and is trending downwards.


Today the Dow Jones Industrial index opened high at and went upto and touched 11,200 and then at end of trading day, collapsed back to 11098.

It appears that it still can not find the strength to cross the 11,200 mark.
The bears are still powerful.

The important Dow levels are 11,200 for it to be bullish and 11,024 for Dow to be bearish.

I have listed some stocks for SHORT SELLING for those interested in it.


(c) Dreamtai Stock Trading Software

Monday, May 22, 2006

DreamTai Stock Trading Software : Tuesday, May 23, 2006


(c) Dreamtai Stock Trading Software


As mentioned in the last posting, if Dow goes above 11,200 then it is a bullish sign. Below 11,070 means that Dow wants to be bearish and is trending downwards.


Today, the market just chopped between these levels. It almost reached 11,200 and closed at
11,125.

You can see the conflict here. On one hand, the market is way too oversold and wants to go up. But, it faces bearish pressure which did not allow it to move up. So, the market just chopped in a flat boring range.

No stock picks today. I would prefer to wait for the market to show its hand before buying any new stocks.


If you wish to view the Dow Jones Industrial Average in DreamTai, the ticker symbol is ^DJI


Disclaimer: For education/entertainment purpose only. Invest at your own Risk

Sunday, May 21, 2006

DreamTai Stock Trading Software : Monday, May 22, 2006


(c) Dreamtai Stock Trading Software


On Friday, the Dow went below 11,100 (which we mentioned before was a key level, the bottom of a channel pattern ) and then popped up again.

The Dow has sold off 700 points from last week's highs without much of a retracement at all and is now hovering around 11,100 level.

On Monday we shall see if the Dow wants to go upwards to trend towards the top of the channel or it wants to remain in a bearish mode and go down.


If Dow goes above 11,200 then it is a bullish sign. Below 11,070 means that Dow wants to be bearish and is trending downwards.

I would prefer to wait for the market to show its hand before buying any new stocks or remaining in cash.


If you wish to view the Dow Jones Industrial Average in DreamTai, the ticker symbol is ^DJI

Notice how DreamTai showed the Green (Bullish LONG ) signals as shown by the Blue Arrows and how you could have profitted from it.

As explained before, the Red price bars are only used to cover existing long positions. (Sell the stocks you have purchased) The Red bars are NOT used to initiate short positions, because the overall trend is up ( Because the blue dotted line is sloping upwards)


Here is one stock that is trending upwards (LTD)


Disclaimer: For education/entertainment purpose only. Invest at your own Risk

Friday, May 19, 2006

DreamTai Stock Trading Software : WHAT IS SHORTING AND GOING LONG ?


(c) Dreamtai Stock Trading Software


Disclaimer: For education/entertainment purpose only. Invest at your own Risk


WHAT IS THE MEANING OF GOING LONG AND COVERING YOUR LONG POSITIONS ?


A stock represents a share in a company. If you buy 100 stocks of Microsoft, it means that you are a part owner of Microsoft.
Of course, that does not mean that you can go and tell Bill Gates how to run this company.
That is because you just have 100 stocks of Microsoft. There are millions of shares of Microsoft traded in the stock market.

If you purchased a sizable amount of stock and become one of the major stock holder of the company, then you can meet the management and influence the company policies.

But that is usually not the reason you purchase stock.

Usually you purchase stocks in the hope that the price of the traded stock goes up and you can sell it to someone else at a profit.

Suppose you notice that the stock of Google is moving up.
At present, assume that the price of a Google share is $350.

You think that this stock may go up.
So, you call your stock broker or go to his web site and place a order to purchase 10 shares of Google for a total cost of $ 350 x 10 = $ 3500 This purchasing of stock is also called GOING LONG. So, you are LONG ON GOOGLE now which means you have purchased some shares in Google.


So, from your brokerage account, $ 3500 will be subtracted and you will be the proud owner of 10 shares of Google.

You track the price of Google every day. You have great hopes for this stock. Some day the stock price moves up by $20 and you are really happy.
Some day, the price of stock decreases by $ 30 and you are sad.

Let us say after some time, you decide to sell your shares of Google. May be, you need the money or Dreamtai gave a Sell signal or some friend warned you that the market is going to crash and it is safe to sell all your stocks now.

Suppose the price of Google now is $ 400
Since you purchased 10 shares of Google for $ 350 and now you are selling it for $ 400, you are making a profit of $ 400 -$350 = $ 50 per share, that is $ 50 x $ 10 = $ 500 for ten shares.

You ask your broker to sell the shares of Google. So,your broker will sell the stock for a total of $ 4000 and that amount ill be deposited in your brokerage account.
Now, you will have zero shares of Google and $ 4000 deposited in your bank account.
This process of selling your existing shares is called COVERING YOUR EXISTING LONG POSITIONS.
Previously, you were long on Google but now, you have covered your long position.
Now, you do not have any stocks. but you just had $ 500 gain by trading in stocks.


Here is how DreamTai would have helped you for buying and selling Google stock.
You would check Google stock in DreamTai every day.

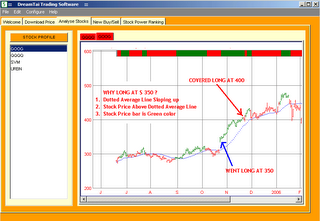
One day around mid - October , you notice that when the stock is at $ 350, the three conditions for BUY signal are fulfilled in Dreamtai:

1. Dotted Average Line Sloping up
2. Stock Price Above Dotted Average Line
3. Stock Price bar is Green color

You would have purchased Google and then checked Google stock chart in Dreamtai every day.

One day you notice (around mid November 2005), that the Google price bar is painted RED color. This means, you have to cover your long.
and sell your existing positions.


WHAT IS THE MEANING OF GOING SHORT ( SHORTING ) AND COVERING YOUR SHORT POSITIONS ?


You will have the ability (once you open your brokerage account) to sell a stock you don't even own, and the money for the sale will show up in your account!!

What's this, you say? Sell something I don't even own?

Yes, and here is how it works: Suppose you think the ABC company is going to fall like a rock today.

You can literally call your broker and say, "I would like to sell 300 shares of ABC short " and the broker will then place an order to sell 300 shares of ABC.

Let us assume ABC is selling for 50 dollars per share.

What is happening is that the broker will "lend" you the 300 shares of ABC to sell.
So in a few moments you find out that you have just gotten 15,000 dollars in your account.

Now if you are correct and ABC does indeed fall, you simply buy it back on the open market and give it back to the broker who loaned it to you.

This is called covering your short.

So now let us assume ABC fell to 46 dollars over the course of a few days. You buy it back at 46 and the difference between what you sold it at (50) and what you replaced it at (46) is your profit.


The key of course is being right on your assumption that ABC is going to fall, or you will end up having to buy it higher than you sold it for the purpose of replacing it with your broker.


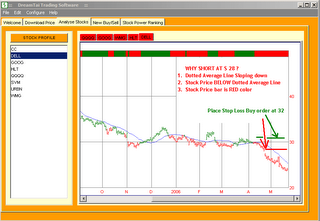
One day around mid - April 2006, you notice that when the DELL stock is at $ 28, the three conditions for SHORTING signal are fulfilled in Dreamtai:

1. Dotted Average Line Sloping down
2. Stock Price BELOW Dotted Average Line
3. Stock Price bar is RED color

You would have SHORTED DELL at $28 and then checked DELL stock chart in Dreamtai every day.

Currently, the DELL stock is around $ 24. The price bar in Dreamtai is still Red color. When the color changes to Green, you have to cover your existing short position. That is, you have to buy Dell stock to give it back to the broker who loaned it to you when you shorted the stock.


WHAT IS A STOP LOSS ORDER ?


There is a very important concept called a "stop loss order."

This is where you tell the broker that you want to attach a stop loss order on your stock and it works like a guard for you when you are away from the market.

No one picks winning trades every time, and you will not be the first. That means that you are going to buy a stock that not only doesn't rise for you, it sinks like a stone!!

If you are watching it happen you can call your broker and tell him to SELLLLL!!!!!!

But what if you are out on the lake with your kids?

A stop loss will save you from a horrible shock by selling your stock for you at a pre determined loss point.

Suppose you bought ABC with the concept that it was going to fly, but one hour after you bought the stock they released news that their Asian unit just went bankrupt?

The stock would fall like the proverbial rock, so to protect yourself we recommend using stop orders.
Suppose DreamTai informs you to buy (go long) 100 shares of ABC stock at price of $ 45 and stop of $42
This means you buy the stock if it goes above $ 45 and place a stop sell order of $ 42.

This means if the stock you has purchased at $45 falls below $ 42, the broker will automatically sell the stocks for you.
So, you will be protected from furthur loss if the stock goes below $ 42.

Similarly, suppose you have Shorted a stock at $25 (Sold without owning the stock)
and DreamTai tells you to place a stop order at $ 28.

You tell the broker to place a stop buy order at $28.
That means that if the stock rises above 28, the broker will buy the stock and cover your short position.

So, your maximum loss is $ 28 -$25 = $ 3 per share


(c) Dreamtai Stock Trading Software

Thursday, May 18, 2006

DreamTai Stock Trading Software : Thursday, May 18, 2006


(c) Dreamtai Stock Trading Software


Disclaimer: For education/entertainment purpose only. Invest at your own Risk


Here is the analysis of the Weekly Dow Jones Industrial Average chart. The market has been moving in a channel pattern for a long time.

It is now way oversold and is due for a correction to the upside.

If that does not happen and the market falls below 11,100 then Oh-Boy-Oh...!!..It is very bearish.
If the market falls then the next downwards target is 10,900
If the market rises, it will rise towards the top of the channel pattern.


As for us, we do not aim to predict the market. That is not our job. Our job is to PROFIT from the market trends.

We react and base our trading strategy based on the market trends.

Till now, the market has been trending upwards in a sloping channel pattern.

If it breaks the trend, we turn bearish and search for bearish stocks to short.

Many members have asked me to provide a detailed explaination about shorting shares. I will be putting out an article explaining what is shorting during this week end.


(c) Dreamtai Stock Trading Software

Wednesday, May 17, 2006

Stock Picks for Thursday, May 18, 2006

No Stock Picks for today.

Please wait for the market to improve before buying any new stocks.

Tuesday, May 16, 2006

DreamTai Stock Trading Software : Wednesday, May 17, 2006


(c) Dreamtai Stock Trading Software


Disclaimer: For education/entertainment purpose only. Invest at your own Risk


The markets are still weak but are trying to improve and go up.
Let us wait and see. Below are two stocks trending up. Keep an eye on them. I would prefer that the market improves before buying more new stocks.


(c) Dreamtai Stock Trading Software

Saturday, May 13, 2006

Stock Trend and Trading Strategy : Saturday May 13, 2006


(c) Dreamtai Stock Trading Software


One of our member had asked a question if a Red bar means to Sell the stock which you had purchased before or does it means to Short Sell the stock.

The answer is that the trading strategy you follow depends on the trend.

How do you define a Stock Trend ?


Here I am showing three example charts by which you can visually determine the trend of a chart.

1. For an Uptrending Chart, the twenty day moving average ( the blue dotted line in DreamTai Stock Trading Software ) is sloping upwards and the price bars are MOSTLY above the moving average line.


For this stock, you can either go long ( buy the stock) when Dreamtai gives the Green buy signal or stay away from it. But , do not try to SHORT SELL this stock ( even if you see a Red SELL signal), because the overall trend is up.
For an uptrending stock, a Red Sell signal in Dreamtai means sell existing long positions in the stock. It does not mean that you have to Short Sell the stock.


2. For the DownTrending Chart, the twenty day moving average ( the blue dotted line in DreamTai Stock Trading Software ) is sloping downwards and the price bars are MOSTLY below the moving average line.

For this stock, you can either go short ( Short Sell the stock) when Dreamtai gives the Red Sell signal or stay away from it. But , do not try to BUY this stock, because the overall trend is down.


For a downtrending stock, a Green BUY signal in Dreamtai means to cover existing short positions in the stock. It does not mean that you have to Buy the stock.


3. For the Sidewards Chart, the twenty day moving average ( the blue dotted line in DreamTai Stock Trading Software ) is flat and the price bars are MOSTLY oscillating around the moving average line ( the blue dotted line in DreamTai Stock Trading Software )


This is the most dangerous chart. Many Traders have taken huge losses trying to predict top and bottom for this type of market.

The best strategy is to stay away from this stock.
Go and search for some other trending stock. There are hundreds of stocks to trade.

So, when you select a stock for trading, be sure to select a trending stock ( Up trending or downtrending ) and base your trading strategy upon that.


(c) Dreamtai Stock Trading Software

DreamTai Stock Trading Software : Saturay, May 13, 2006


(c) Dreamtai Stock Trading Software


As you have seen in the past two days, the markets have moved down.
This down move has taken many unaware investors by surprise.
However, DreamTai users will have nothing to fear about.

Why ? Because they are already prepared for this event. They have anticipated the worst possible scenario and have already placed their stop loss sell orders, when they purchased the stock.
So, if the stock they have purchased moves down, due to the stop loss sell order, the maximum they can lose is two percent of their equity.

Rember, making a loss in a trade is not bad, however, NOT following your trading plan and discipline can be injurious to your financial health.

Whether or not the market will recover in upcoming weeks remains to be seen.
Till then, it is a great time to hold off new buys.

(c) Dreamtai Stock Trading Software

Friday, May 12, 2006

DreamTai Stock Trading Software : Friday, May 12, 2006

(c) DreamTai Stock Trading Software


Disclaimer: For education/entertainment purpose only. Invest at your own Risk


We had shown ABB before also. Well!! some things just keep trending...on and on.....That is good news for us :-))


(c) DreamTai Stock Trading Software

Thursday, May 11, 2006

DreamTai Stock Trading Software : Thursday, May 11, 2006

(c) DreamTai Stock Trading Software


Disclaimer: For education/entertainment purpose only. Invest at your own Risk


We had shown KKD (Krispy Kreme Donuts) before also. Well!! some things just keep trending...on and on.....That is sweet news for us :-))


(c) DreamTai Stock Trading Software

Tuesday, May 09, 2006

DreamTai Stock Trading Software : Wednesday, May 10, 2006

(c) DreamTai Stock Trading Software


Disclaimer: For education/entertainment purpose only. Invest at your own Risk


We had shown HLT [Hilton Hotels ] before also. Well!! some things just keep trending...on and on.....Good for us :-))


(c) DreamTai Stock Trading Software

Monday, May 08, 2006

DreamTai Stock Trading Software : Tuesday, May 9, 2006

(c) DreamTai Stock Trading Software


Disclaimer: For education/entertainment purpose only. Invest at your own Risk


(c) DreamTai Stock Trading Software