(c) Dreamtai Stock Trading Software
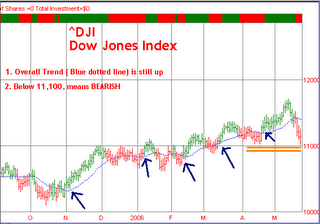
On Friday, the Dow went below 11,100 (which we mentioned before was a key level, the bottom of a channel pattern ) and then popped up again.
The Dow has sold off 700 points from last week's highs without much of a retracement at all and is now hovering around 11,100 level.
On Monday we shall see if the Dow wants to go upwards to trend towards the top of the channel or it wants to remain in a bearish mode and go down.
If Dow goes above 11,200 then it is a bullish sign. Below 11,070 means that Dow wants to be bearish and is trending downwards.
I would prefer to wait for the market to show its hand before buying any new stocks or remaining in cash.

If you wish to view the Dow Jones Industrial Average in DreamTai, the ticker symbol is ^DJI
Notice how DreamTai showed the Green (Bullish LONG ) signals as shown by the Blue Arrows and how you could have profitted from it.
As explained before, the Red price bars are only used to cover existing long positions. (Sell the stocks you have purchased) The Red bars are NOT used to initiate short positions, because the overall trend is up ( Because the blue dotted line is sloping upwards)
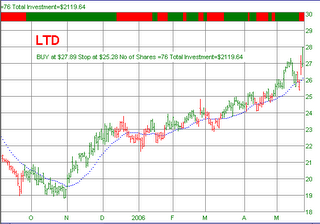
Here is one stock that is trending upwards (LTD)

Disclaimer: For education/entertainment purpose only. Invest at your own Risk