Here is the Dow Jones Index.
Market is still bearish.
Nothing new!!
Don't you really really miss the dot com days (1997-2000), when anything you touched turned to gold?
You just had to buy any stock and it would just go up and up and up..Ahh..the good old days of the "bubble"!!
After all, all good things just have to come to an end and bubbles would have to burst some day.
CLICK TO ENLARGE==>
Welcome to DreamTai Stock Trading Software blog. Here, DreamTai members can post their views, ideas, opinions and list of stocks which they like and which have given a Buy Signal or Sell signal by DreamTai stock Trading Software.
Sunday, February 22, 2009
DreamTai 5.02.13 Sneak Preview
DreamTai 5.02.13 is to be released in March 2009.
Here are the new features added to DreamTai.
You can have upto 20 different watchlist. If you store around 50 stocks per watchlist, you can track theoretically 1000 stocks. However, at any time, only one watchlist will be active.
Drawing tools have been added so that you can draw trend lines, fibonacci retracements, circles.
You can change the pen colors.
You can delete the trend lines you have drawn if you want to redraw them.
You can take screenshot directly from the chart.
You can change the bear bar color and the bull bar color. (Some users have difficulty viewing the red and green colors.)
First,a beta version will be released so that if there are any bugs they can be fixed. After that, the final version will be released in March.
Please do send me your comments and suggestions.
(sales@dreamtai.com)
Labels:
Dreamtai Stock Trading Software
Monday, February 16, 2009
Market status as on Feb 16, 2009
CLICK on picture to enlarge.
The market is still BEARISH.
Not a good place for the longs.
Not a good time to buy.
There may be a chance that it could get support at 7500 to 8000 zone, because that was the place where there was previous support in 2002.
Let us see what happens.
The market is still BEARISH.
Not a good place for the longs.
Not a good time to buy.
There may be a chance that it could get support at 7500 to 8000 zone, because that was the place where there was previous support in 2002.
Let us see what happens.
Labels:
Finance
Sunday, February 08, 2009
Market Status as on Feb 8, 2009
The long term status is still down.
Look at the chart and study it. The chart tells it all.
Click on the chart to enlarge it.
Look at the chart and study it. The chart tells it all.
Click on the chart to enlarge it.
Labels:
Dreamtai Stock Trading Software
Stocks moving up
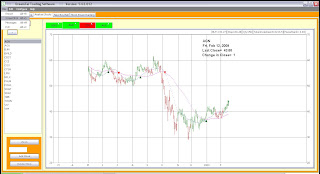
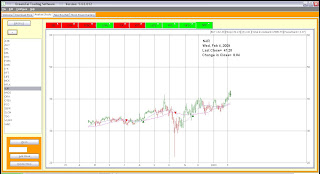
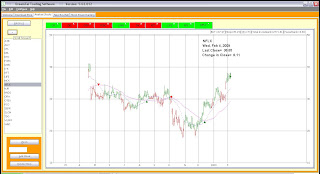
Here are some stocks which are trending up on a long term basis.
Have a look at the charts and you will notice that they are slowing but steadily trending up from the bottom.
Try to look at the common pattern in all these charts. You will notice that they form a "saucer" formation. Just like a saucer or a bowl, the charts curve inwards and then curve up.
Here are some links which describe this pattern
http://daily-stocks.netfirms.com/ld/saucer-patterns.htm
http://www.investopedia.com/university/charts/charts10.asp
If you plan to trade this , please follow DreamTai's rule of risk control..risk no more than 2 percent maximum of your total investment capital per trade.
TRA
RIMM
POT
MOS
IBM
GOOG
GME
Labels:
Dreamtai Stock Trading Software
Wednesday, February 04, 2009
Subscribe to:
Posts (Atom)